How to Graph Vital Signs
Summary
Vital signs can be entered both on the visit record and on the VISIT tab of the EMR. The full history of vital signs for a patient can be viewed on the CLINICAL RESULTS tab of the patient chart.
For patients between the ages of 2 to 20 years old, a Growth Chart can be generated in the Standard CDC Growth Chart format. This format will plot the patient’s height, weight and BMI history over time. Their growth on the chart along with a comparison to statistical recorded norms of male or females across the country for 2 to 20 year olds.
From Enter Visit
To get to the Graph button from the Enter Visit window select the Charges tab.
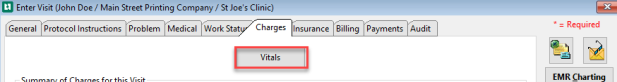
Select Vitals, then Enter Vitals Signs window, select Readings tab.
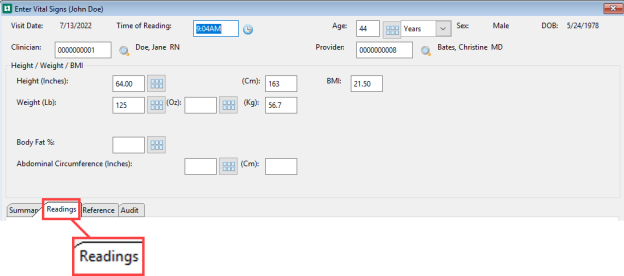
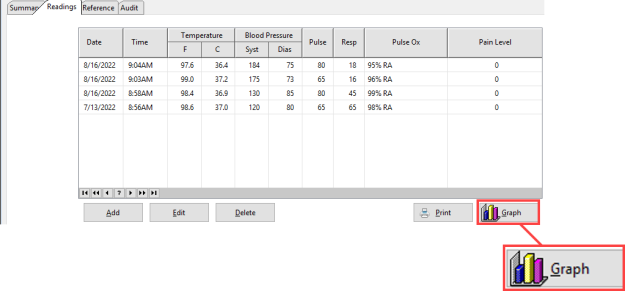
From The Reading tab select Graph.
From the EMR Charting Workspace
To get to the Graph button from the EMR Charting Workspace, at the bottom of the Visit tab, select Graph.
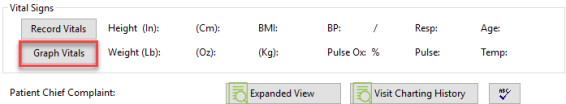
Vital signs can be graphed from the VISIT tab of the EMR or the patient chart.
-
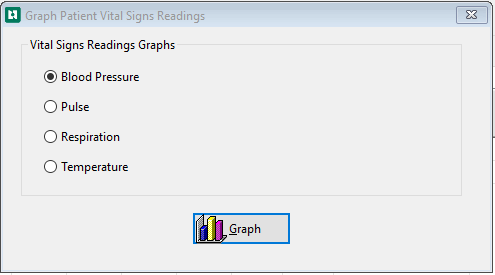
Click the Graph button to display the [Graph Patient Vital Signs] window.
-
Select the vital sign you want to graph.
-
If there are not at least two vital signs records for this patient, all the options will be
refers to part of a screen that cannot be used because it is inactive or otherwise not accessible. This part of the screen appears slightly gray.
grayed out refers to part of a screen that cannot be used because it is inactive or otherwise not accessible. This part of the screen appears slightly gray. .
-
Five alternatives are shown in the Growth Charts section. Each of these is available only when vital signs have been recorded for the indicated age range.
-
-
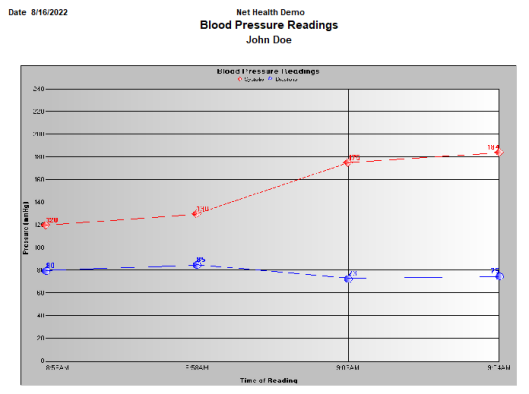
Click Graph to display the graph. A pop-up window will display a graph of the full history of this vital sign for this patient.
-
Click Print to send the graph to the printer.
-
Close the window.